# data
set(123)
x <- rnorm(1000, 50, 30)
y <- 3*x + rnorm(1000, 0, 20)
require(Hmisc)
plot(x,y)
#scat1d adds tick marks (bar codes. rug plot)
# on any of the four sides of an existing plot,
# corresponding with non-missing values of a vector x.
scat1d(x, col = "red") # density bars on top of graph
scat1d(y, 4, col = "blue") # density bars at right
plot(x,y, pch = 19)
histSpike(x, add=TRUE, col = "green4", lwd = 2)
histSpike(y, 4, add=TRUE,col = "blue", lwd = 2 )
histSpike(x, type='density',col = "red", add=TRUE) # smooth density at bottom
histSpike(y, 4, type='density', col = "red", add=TRUE)
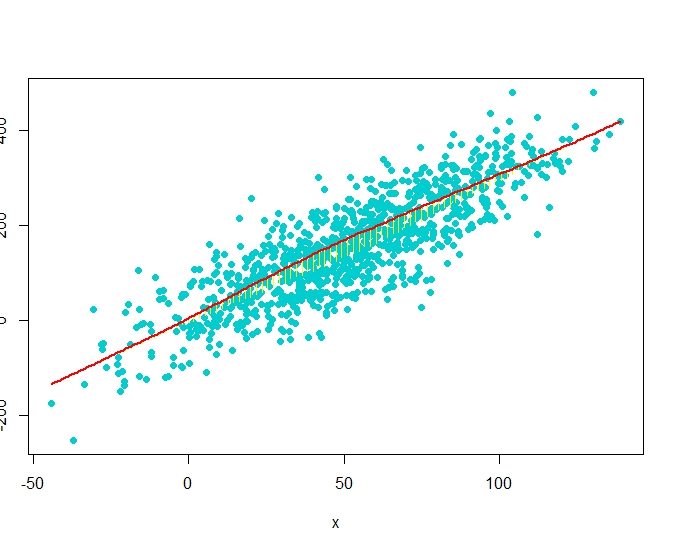
plot(x,y, pch = 19)
smooth <- lowess(x, y)    # add nonparametric regression curve
lines(smooth, col = "red")             # Note: plsmo() does this
scat1d(x, y=approx(smooth, xout=x)$y, col = "yellow") # data density on curve
scat1d(x, curve=smooth, col = "yellow") # same effect as previous command
# data
set(123)
x <- rnorm(1000, 50, 30)
y <- 3*x + rnorm(1000, 0, 60)
plot(x,y, pch = 19, col = "cyan3")
histSpike(x, curve=smooth, add=TRUE, col = "yellow") # same as previous but with histogram
histSpike(x, curve=smooth, type='density', col = "red",lwd=2, add=TRUE)


No comments:
Post a Comment
Note: Only a member of this blog may post a comment.